Grafana Configuration
Grafana is a tool that allows you to visualize time series metrics through graphs and dashboards. It supports several backend data stores, including InfluxDB. GitLab writes performance data to InfluxDB and Grafana will allow you to query InfluxDB to display useful graphs.
For the easiest installation and configuration, install Grafana on the same server as InfluxDB. For larger installations, you may want to split out these services.
Installation
Grafana supplies package repositories (Yum/Apt) for easy installation. See Grafana installation documentation for detailed steps.
Note: Before starting Grafana for the first time, set the admin user and password in
/etc/grafana/grafana.ini. Otherwise, the default password will beadmin.
Configuration
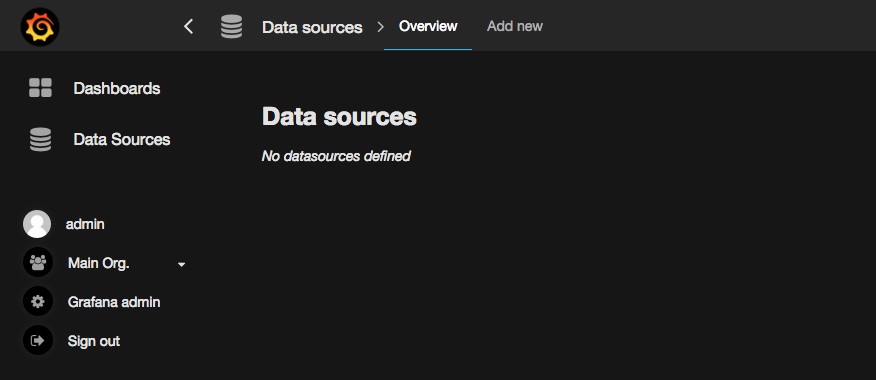
Login as the admin user. Expand the menu by clicking the Grafana logo in the top left corner. Choose 'Data Sources' from the menu. Then, click 'Add new' in the top bar.
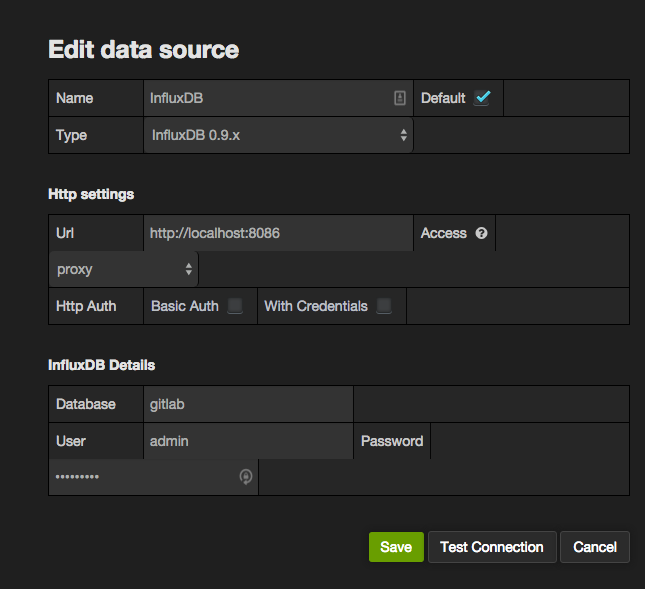
Fill in the configuration details for the InfluxDB data source. Save and Test Connection to ensure the configuration is correct.
- Name: InfluxDB
- Default: Checked
- Type: InfluxDB 0.9.x (Even if you're using InfluxDB 0.10.x)
- Url: https://localhost:8086 (Or the remote URL if you've installed InfluxDB on a separate server)
- Access: proxy
- Database: gitlab
- User: admin (Or the username configured when setting up InfluxDB)
- Password: The password configured when you set up InfluxDB
Apply retention policies and create continuous queries
If you intend to import the GitLab provided Grafana dashboards, you will need to copy and run a set of queries against InfluxDB to create the needed data sets.
On the InfluxDB server, run the following command, substituting your InfluxDB user and password:
influxdb --username admin -password super_secretThis will drop you in to an InfluxDB interactive session. Copy the entire contents below and paste it in to the interactive session:
CREATE RETENTION POLICY gitlab_30d ON gitlab DURATION 30d REPLICATION 1 DEFAULT
CREATE RETENTION POLICY seven_days ON gitlab DURATION 7d REPLICATION 1
CREATE CONTINUOUS QUERY rails_transaction_counts_seven_days ON gitlab BEGIN SELECT count("duration") AS "count" INTO gitlab.seven_days.rails_transaction_counts FROM rails_transactions GROUP BY time(1m) END;
CREATE CONTINUOUS QUERY sidekiq_transaction_counts_seven_days ON gitlab BEGIN SELECT count("duration") AS "count" INTO gitlab.seven_days.sidekiq_transaction_counts FROM sidekiq_transactions GROUP BY time(1m) END;
CREATE CONTINUOUS QUERY rails_method_call_timings_seven_days ON gitlab BEGIN SELECT percentile("duration", 95.000) AS "duration_95th", percentile("duration", 99.000) AS "duration_99th", mean("duration") AS "duration_mean" INTO gitlab.seven_days.rails_method_call_timings FROM rails_method_calls GROUP BY time(1m) END;
CREATE CONTINUOUS QUERY sidekiq_method_call_timings_seven_days ON gitlab BEGIN SELECT percentile("duration", 95.000) AS "duration_95th", percentile("duration", 99.000) AS "duration_99th", mean("duration") AS "duration_mean" INTO gitlab.seven_days.sidekiq_method_call_timings FROM sidekiq_method_calls GROUP BY time(1m) END;
CREATE CONTINUOUS QUERY rails_method_call_timings_per_method_seven_days ON gitlab BEGIN SELECT percentile("duration", 95.000) AS duration_95th, percentile("duration", 99.000) AS duration_99th, mean("duration") AS duration_mean INTO gitlab.seven_days.rails_method_call_timings_per_method FROM rails_method_calls GROUP BY time(1m), method END;
CREATE CONTINUOUS QUERY sidekiq_method_call_timings_per_method_seven_days ON gitlab BEGIN SELECT percentile("duration", 95.000) AS duration_95th, percentile("duration", 99.000) AS duration_99th, mean("duration") AS duration_mean INTO gitlab.seven_days.sidekiq_method_call_timings_per_method FROM sidekiq_method_calls GROUP BY time(1m), method END;
CREATE CONTINUOUS QUERY rails_memory_usage_per_minute ON gitlab BEGIN SELECT percentile(value, 95.000) AS memory_95th, percentile(value, 99.000) AS memory_99th, mean(value) AS memory_mean INTO gitlab.seven_days.rails_memory_usage_per_minute FROM rails_memory_usage GROUP BY time(1m) END;
CREATE CONTINUOUS QUERY sidekiq_memory_usage_per_minute ON gitlab BEGIN SELECT percentile(value, 95.000) AS memory_95th, percentile(value, 99.000) AS memory_99th, mean(value) AS memory_mean INTO gitlab.seven_days.sidekiq_memory_usage_per_minute FROM sidekiq_memory_usage GROUP BY time(1m) END;
CREATE CONTINUOUS QUERY sidekiq_file_descriptors_per_minute ON gitlab BEGIN SELECT sum(value) AS value INTO gitlab.seven_days.sidekiq_file_descriptors_per_minute FROM sidekiq_file_descriptors GROUP BY time(1m) END;
CREATE CONTINUOUS QUERY rails_file_descriptors_per_minute ON gitlab BEGIN SELECT sum(value) AS value INTO gitlab.seven_days.rails_file_descriptors_per_minute FROM rails_file_descriptors GROUP BY time(1m) END;
CREATE CONTINUOUS QUERY rails_gc_counts_per_minute ON gitlab BEGIN SELECT sum(count) AS count INTO gitlab.seven_days.rails_gc_counts_per_minute FROM rails_gc_statistics GROUP BY time(1m) END;
CREATE CONTINUOUS QUERY sidekiq_gc_counts_per_minute ON gitlab BEGIN SELECT sum(count) AS count INTO gitlab.seven_days.sidekiq_gc_counts_per_minute FROM sidekiq_gc_statistics GROUP BY time(1m) END;
CREATE CONTINUOUS QUERY rails_gc_timings_per_minute ON gitlab BEGIN SELECT percentile(total_time, 95.000) AS duration_95th, percentile(total_time, 99.000) AS duration_99th, mean(total_time) AS duration_mean INTO gitlab.seven_days.rails_gc_timings_per_minute FROM rails_gc_statistics GROUP BY time(1m) END;
CREATE CONTINUOUS QUERY sidekiq_gc_timings_per_minute ON gitlab BEGIN SELECT percentile(total_time, 95.000) AS duration_95th, percentile(total_time, 99.000) AS duration_99th, mean(total_time) AS duration_mean INTO gitlab.seven_days.sidekiq_gc_timings_per_minute FROM sidekiq_gc_statistics GROUP BY time(1m) END;
CREATE CONTINUOUS QUERY rails_gc_major_minor_per_minute ON gitlab BEGIN SELECT sum(major_gc_count) AS major, sum(minor_gc_count) AS minor INTO gitlab.seven_days.rails_gc_major_minor_per_minute FROM rails_gc_statistics GROUP BY time(1m) END;
CREATE CONTINUOUS QUERY sidekiq_gc_major_minor_per_minute ON gitlab BEGIN SELECT sum(major_gc_count) AS major, sum(minor_gc_count) AS minor INTO gitlab.seven_days.sidekiq_gc_major_minor_per_minute FROM sidekiq_gc_statistics GROUP BY time(1m) END;
CREATE CONTINUOUS QUERY grape_internal_allowed_request_counts_per_minute ON gitlab BEGIN SELECT count("duration") AS count INTO gitlab.seven_days.grape_internal_allowed_request_counts_per_minute FROM rails_transactions WHERE request_uri = '/api/v3/internal/allowed' GROUP BY time(1m) END;
CREATE CONTINUOUS QUERY grape_internal_allowed_request_timings_per_minute ON gitlab BEGIN SELECT percentile("duration", 95) AS duration_95th, percentile("duration", 99) AS duration_99th, mean("duration") AS duration_mean INTO gitlab.seven_days.grape_internal_allowed_request_timings_per_minute FROM rails_transactions WHERE request_uri = '/api/v3/internal/allowed' GROUP BY time(1m) END;
CREATE CONTINUOUS QUERY grape_internal_allowed_sql_timings_per_minute ON gitlab BEGIN SELECT percentile(sql_duration, 95) AS duration_95th, percentile(sql_duration, 99) AS duration_99th, mean(sql_duration) AS duration_mean INTO gitlab.seven_days.grape_internal_allowed_sql_timings_per_minute FROM rails_transactions WHERE request_uri = '/api/v3/internal/allowed' GROUP BY time(1m) END;
CREATE CONTINUOUS QUERY grape_internal_authorized_keys_request_counts_per_minute ON gitlab BEGIN SELECT count("duration") AS count INTO gitlab.seven_days.grape_internal_authorized_keys_request_counts_per_minute FROM rails_transactions WHERE request_uri = '/api/v3/internal/authorized_keys' GROUP BY time(1m) END;
CREATE CONTINUOUS QUERY grape_internal_authorized_keys_request_timings_per_minute ON gitlab BEGIN SELECT percentile("duration", 95) AS duration_95th, percentile("duration", 99) AS duration_99th, mean("duration") AS duration_mean INTO gitlab.seven_days.grape_internal_authorized_keys_request_timings_per_minute FROM rails_transactions WHERE request_uri = '/api/v3/internal/authorized_keys' GROUP BY time(1m) END;
CREATE CONTINUOUS QUERY grape_internal_authorized_keys_sql_timings_per_minute ON gitlab BEGIN SELECT percentile(sql_duration, 95) AS duration_95th, percentile(sql_duration, 99) AS duration_99th, mean(sql_duration) AS duration_mean INTO gitlab.seven_days.grape_internal_authorized_keys_sql_timings_per_minute FROM rails_transactions WHERE request_uri = '/api/v3/internal/authorized_keys' GROUP BY time(1m) END;
CREATE CONTINUOUS QUERY rails_transaction_timings_seven_days ON gitlab BEGIN SELECT percentile("duration", 95.000) AS duration_95th, percentile("duration", 99.000) AS duration_99th, mean("duration") AS duration_mean, percentile(sql_duration, 95.000) AS sql_duration_95th, percentile(sql_duration, 99.000) AS sql_duration_99th, mean(sql_duration) AS sql_duration_mean, percentile(view_duration, 95.000) AS view_duration_95th, percentile(view_duration, 99.000) AS view_duration_99th, mean(view_duration) AS view_duration_mean, percentile(cache_read_duration, 99) AS cache_read_duration_99th, percentile(cache_read_duration, 95) AS cache_read_duration_95th, mean(cache_read_duration) AS cache_read_duration_mean, percentile(cache_write_duration, 99) AS cache_write_duration_99th, percentile(cache_write_duration, 95) AS cache_write_duration_95th, mean(cache_write_duration) AS cache_write_duration_mean, percentile(cache_delete_duration, 99) AS cache_delete_duration_99th, percentile(cache_delete_duration, 95) AS cache_delete_duration_95th, mean(cache_delete_duration) AS cache_delete_duration_mean, percentile(cache_exists_duration, 99) AS cache_exists_duration_99th, percentile(cache_exists_duration, 95) AS cache_exists_duration_95th, mean(cache_exists_duration) AS cache_exists_duration_mean, percentile(cache_duration, 99) AS cache_duration_99th, percentile(cache_duration, 95) AS cache_duration_95th, mean(cache_duration) AS cache_duration_mean INTO gitlab.seven_days.rails_transaction_timings FROM rails_transactions GROUP BY time(1m) END;
CREATE CONTINUOUS QUERY sidekiq_transaction_timings_seven_days ON gitlab BEGIN SELECT percentile("duration", 95.000) AS duration_95th, percentile("duration", 99.000) AS duration_99th, mean("duration") AS duration_mean, percentile(sql_duration, 95.000) AS sql_duration_95th, percentile(sql_duration, 99.000) AS sql_duration_99th, mean(sql_duration) AS sql_duration_mean, percentile(view_duration, 95.000) AS view_duration_95th, percentile(view_duration, 99.000) AS view_duration_99th, mean(view_duration) AS view_duration_mean, percentile(cache_read_duration, 99) AS cache_read_duration_99th, percentile(cache_read_duration, 95) AS cache_read_duration_95th, mean(cache_read_duration) AS cache_read_duration_mean, percentile(cache_write_duration, 99) AS cache_write_duration_99th, percentile(cache_write_duration, 95) AS cache_write_duration_95th, mean(cache_write_duration) AS cache_write_duration_mean, percentile(cache_delete_duration, 99) AS cache_delete_duration_99th, percentile(cache_delete_duration, 95) AS cache_delete_duration_95th, mean(cache_delete_duration) AS cache_delete_duration_mean, percentile(cache_exists_duration, 99) AS cache_exists_duration_99th, percentile(cache_exists_duration, 95) AS cache_exists_duration_95th, mean(cache_exists_duration) AS cache_exists_duration_mean, percentile(cache_duration, 99) AS cache_duration_99th, percentile(cache_duration, 95) AS cache_duration_95th, mean(cache_duration) AS cache_duration_mean INTO gitlab.seven_days.sidekiq_transaction_timings FROM sidekiq_transactions GROUP BY time(1m) END;
CREATE CONTINUOUS QUERY grape_transaction_counts_seven_days ON gitlab BEGIN SELECT count("duration") AS count INTO gitlab.seven_days.grape_transaction_counts FROM rails_transactions WHERE action !~ /.+/ GROUP BY time(1m) END;
CREATE CONTINUOUS QUERY grape_transaction_timings_seven_days ON gitlab BEGIN SELECT percentile("duration", 95.000) AS duration_95th, percentile("duration", 99.000) AS duration_99th, mean("duration") AS duration_mean, percentile(sql_duration, 95.000) AS sql_duration_95th, percentile(sql_duration, 99.000) AS sql_duration_99th, mean(sql_duration) AS sql_duration_mean, percentile(cache_read_duration, 99) AS cache_read_duration_99th, percentile(cache_read_duration, 95) AS cache_read_duration_95th, mean(cache_read_duration) AS cache_read_duration_mean, percentile(cache_write_duration, 99) AS cache_write_duration_99th, percentile(cache_write_duration, 95) AS cache_write_duration_95th, mean(cache_write_duration) AS cache_write_duration_mean, percentile(cache_delete_duration, 99) AS cache_delete_duration_99th, percentile(cache_delete_duration, 95) AS cache_delete_duration_95th, mean(cache_delete_duration) AS cache_delete_duration_mean, percentile(cache_exists_duration, 99) AS cache_exists_duration_99th, percentile(cache_exists_duration, 95) AS cache_exists_duration_95th, mean(cache_exists_duration) AS cache_exists_duration_mean, percentile(cache_duration, 99) AS cache_duration_99th, percentile(cache_duration, 95) AS cache_duration_95th, mean(cache_duration) AS cache_duration_mean INTO gitlab.seven_days.grape_transaction_timings FROM rails_transactions WHERE action !~ /.+/ GROUP BY time(1m) END;
Import Dashboards
You can now import a set of default dashboards that will give you a good start on displaying useful information. GitLab has published a set of default Grafana dashboards to get you started. Clone the repository or download a zip/tarball, then follow these steps to import each JSON file.
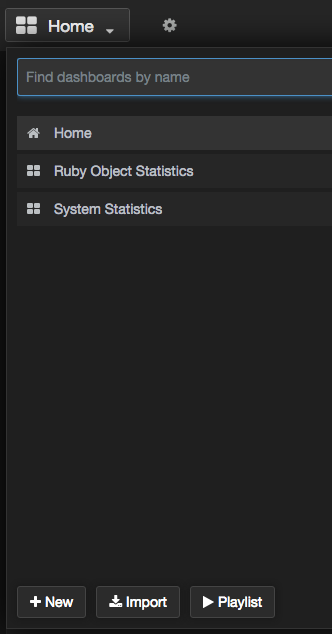
Open the dashboard dropdown menu and click 'Import'
Click 'Choose file' and browse to the location where you downloaded or cloned the dashboard repository. Pick one of the JSON files to import.
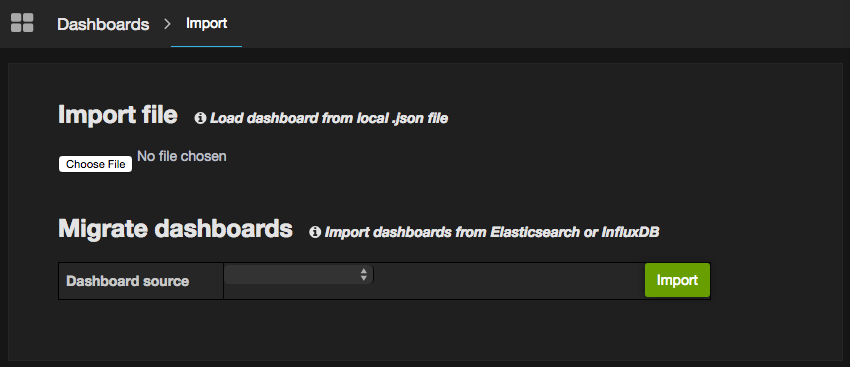
Once the dashboard is imported, be sure to click save icon in the top bar. If you do not save the dashboard after importing it will be removed when you navigate away.
![]()
Repeat this process for each dashboard you wish to import.
Alternatively you can automatically import all the dashboards into your Grafana instance. See the README of the Grafana dashboards repository for more information on this process.
Read more on: